

Are consumer food prices too high in eurozone?
Are consumer food prices too high in eurozone?
Food prices are indeed too high, albeit not for the reason simple graphs suggest.

One question making rounds on twitter is whether consumer food prices in eurozone are too high? Of course, this question makes sense only when taking into account to agricultural prices. In other words the question is ‘Are consumer food prices higher than agricultural prices would justify?’.[1]
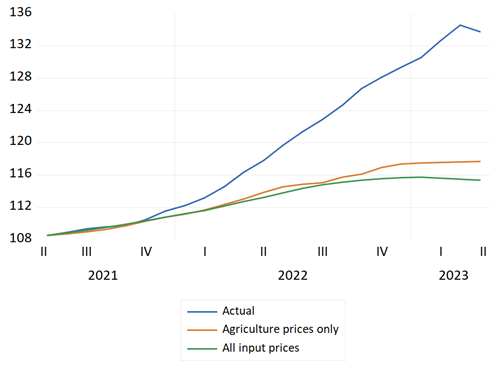
Many people claim that they are indeed higher than is justified, supporting the conclusion by something like following graph while pointing to the right part of the graph, which shows how consumer food prices are still growing rapidly while agriculture prices are dropping:
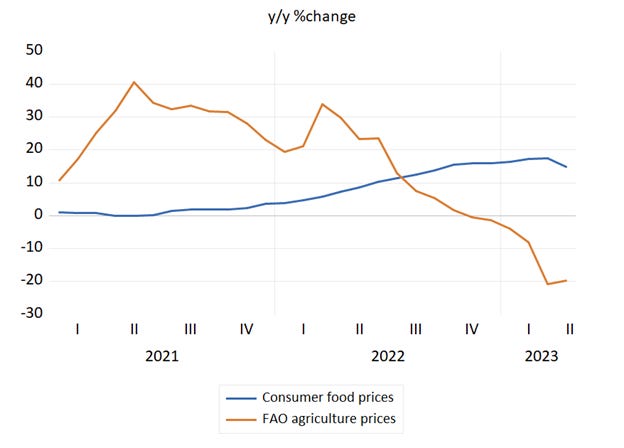
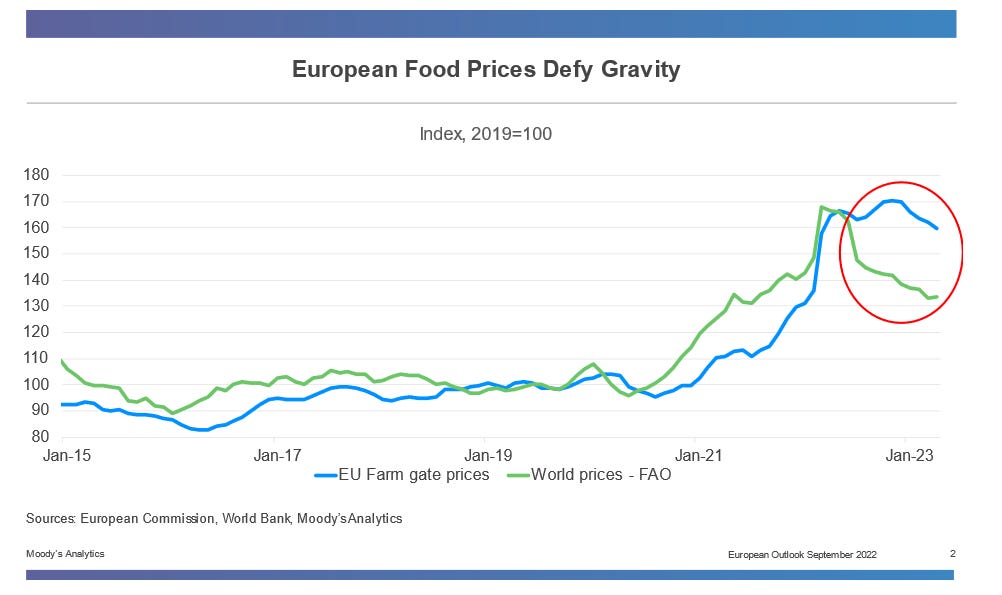
But of course, this does not settle the discussion. At most benign level the above graph shows world agriculture prices (here from FAO, but similar story applies to World Bank series). But that is not the same as European agriculture prices, which so far showed quite different dynamic:
At more substantial level, showing two series in year-over-year transformation and drawing a conclusion might work for a Twitter post, but does not prove much outside Twitter. Even that picture makes it clear that there is a lag between the two series – after all agricultural prices increased a lot before consumer prices showed any movement. So the fact that one series is declining already and the other one not might simply reflect that it is not declining yet. Indeed, April brought a peak in food price inflation and actual outright decline from a previous month, so the consumer food price line will pretty soon follow the agriculture price line lower.
But even more importantly, given the lags and different scales, the year-over-year growth rates make it hard to know the key question: was the size of increase in consumer food prices disproportional to the size of the increase in agriculture prices? To answer that one cannot simply rely on graph of year-over-year growth rates; rather I will show some more serious (but not too serious) econometric estimates.
First attempt: Linking growth rates
Let’s first try to answer our question by using what would be the standard econometric approach: Regress changes in consumer food prices on changes in agricultural prices and their lags in ARDL-type of model. The resulting model is ARDL(1,8) and explains one quarter of variation in monthly growth rates.[2] The model implies that 10% increase in farm gate prices leads to maximum increase of bit more than 1% increase in consumer food prices, but it takes almost a year.[3]
The crucial graph is the following one, showing the (ex post) forecast for consumer food prices when one feeds in the actual agricultural prices we observed over last two years:
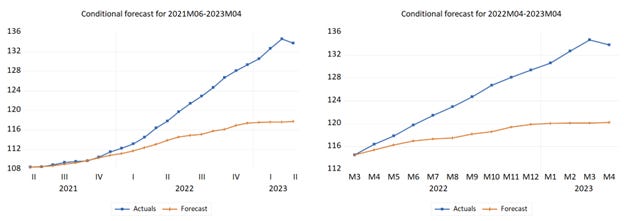
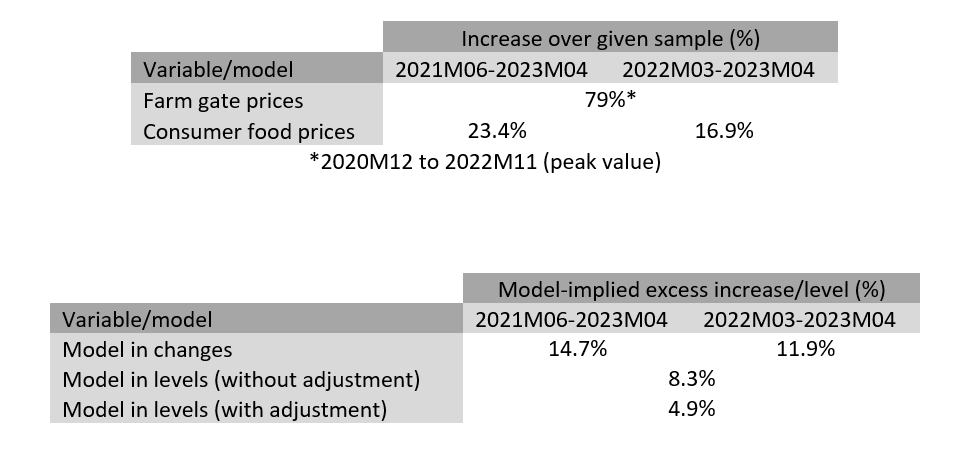
The key takeaway is that according to this model consumer prices should have increased by roughly 9% between summer 2021 and spring 2023, or by 5% between spring 2022 and spring 2024. Both increases are a fraction of the actual observed increase (23% and 17%, respectively). This suggests that based on this model eurozone consumer food prices are indeed too high given the evolution in farm gate prices. Indeed, they are extremely too high, 12-15% too high.
One possible objection is that the model is not being suitable for periods when agriculture/food prices increase rapidly. But looking at the previous historical periods with rapid increases in agricultural/food prices, this does not seem to be the case:
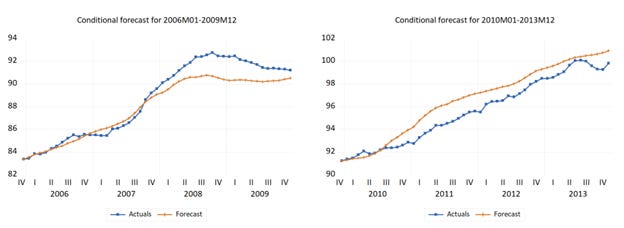
The model is able to predict the large increase in 2006-2008 period, and actually predicts larger-than-observed increase in 2010-2013.[4]
Second attempt: Including energy prices
One problem might be that the rise in food prices this time around is due to combination of rise in agricultural prices with rise in other important inputs, such as oil and fertilizer prices. To judge that I estimate model that includes these variables as well.[5]
The results are actually worse than before, which in some sense is not that surprising, given that oil prices have increased less than agricultural prices:
Overall, using the standard approach of linking changes in consumer food prices to changes in input prices, either more narrowly or more broadly defined, we are left with conclusion that consumer food prices have increased disproportionally relative to what the input costs would suggest.
Third attempt: Looking at levels
However, this is not the end the story. Why? The reason is that given the complicated, potential state-dependent link between changes in agriculture prices and changes in consumer food prices, our model might be struggling to capture the full extent of pass-through from the former to the latter.
An alternative is to instead focus on levels of both series. The idea is simple: agriculture products are the main input cost for consumer food prices, and hence consumer food prices should be simply equal to agriculture prices plus a (possibly time varying) mark up. This would then imply that there should be tight relationship between level of agriculture prices and level of consumer food prices.[6]
Here is estimation output and model fit for model linking levels of both variables:
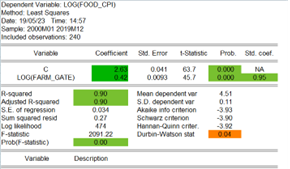
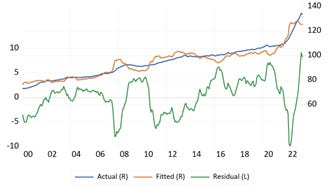
The key takeaway is that this model to a large degree overturns the conclusions from the previous models. Even taking the residual for April 2023 at face value, the model suggest that consumer food prices are too high by less than 10%, rather than significantly more than 10%. But the residual should not be taken at face value, but rather compared with residual values in recent past, to account for the model imperfection.[7] And this revels that the residual is barely higher than in summer 2020, or less than 5% higher than the 2018-2019 average. This suggests much smaller difference between “appropriate level” of food prices and actual level of food prices, somewhere between 1% and 8%.
What is behind the starkly different conclusion, when compared with the previous model? The main difference is the estimated pass-through from agriculture prices to consumer food prices. The models linking changes suggested pass-through of 0.1 (10% increase in agriculture prices leads to 1% increase in consumer food prices). The model linking levels suggest four times as big pass-through. And that then explains the difference: with large pass-through, the level model is not surprised that the large jump in agriculture prices lead to high consumer food prices.
Taking stock
Which model should be trusted? As per usual, none. They are just models. But on the whole I put more stock in the level model, since the use of levels will make it easier to estimate well a long-run pass-through from agricultural to consumer food prices. In contrast model relying on growth rates might struggle with this in the face of state-dependent shape of the pass-through.[8]
So what is the conclusion. Looking at the evidence as a whole, I would say that right now consumer food prices are indeed too high relative to agriculture prices. By how much? The upper bound of my estimate is something like 10%, a slightly shaded down value indicated by the models using growth rates (which I would believe to are likely biased upwards). The lower bound is 3% - I think consumer food prices were already abnormally high in summer of 2020 due to pandemic-induced distortions, and we are 1.5% higher still. And my best guess estimate is something like 5%. In either case, looking at things it is hard to construct econometric estimate which would suggest that consumer food prices are not too high relative to agriculture prices. I will have a follow up post on what this implies.
[1] Of course, it can also be the case that agriculture prices are themselves “too high” relative to their fundamentals. But that is much harder to determine, as we do not have a proper measure of fundamentals, like we do for consumer food prices.
[2] The estimation output is following:
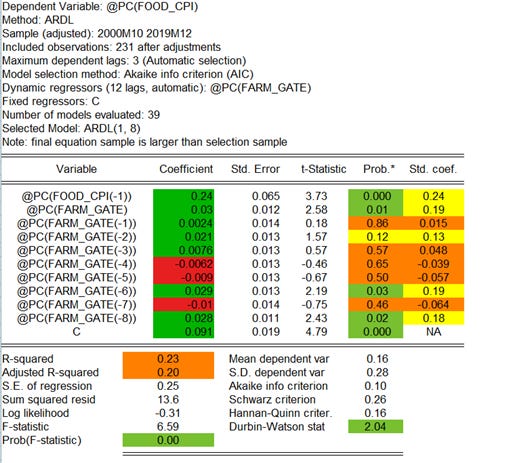
I used automatic ARLD estimation method of EViews with maximum lags of 3 for dependent variable and 12 for independent variable. The estimation output is augmented using the SpecEval add-in.
Note that the model is estimated only on the data up to 2019, so that the following forecast is out-of-sample. If we would use also recent data then we would not be able to use the model to evaluate whether the increase was too large or not.
[3] Here is impulse response for shock to farm gate prices, again created using the SpecEval.

[4] Note that in contrast to the forecasts for recent period, these forecasts are in-sample forecast. The point is the check whether the model used for the forecasting (i.e. estimated on sample up until 2019) is actually able to produce a large rise in consumer food prices in periods when it actually occurred. We are not interested in whether the model would be able to predict the rise in food prices if estimated on data available at given point in time.
[5] Rather than just throwing them in the regression, which would lead to a large number of regressors, we can create amalgam of all inputs. Specifically, we can take the first component of food prices, oil prices and fertilizers and use it in our model.
[6] In econometrics terminology, the two series should be co-integrated. They are both clearly non-stationary, featuring stochastic trend. But the postulation here is that the stochastic trend in consumer food prices is a function of stochastic trend in agriculture prices, and that after accounting for this, there is no residual stationarity. Statistical tests confirm this notion.
As an aside, if indeed the co-integration hypothesis is valid, then the models in terms of growth rates are actually mis-specified, reflecting that they ignore the information contained in levels.
[7] Specifically, the model residuals seems to have a small upward trend: the average value of the residual in 2015-2019 period is higher than the average value in 2000-2005 period, for example. This suggests that the mark-ups between agriculture prices and consumer food prices are increasing over time, causing (relatively slow) increase in consumer prices relative to agriculture prices over time. Why this is so is a different question, but it can be simply a result of real wages trending higher over time combined with the fact that consumer food products are more labor-intensive.
[8] Counterargument is that the level model is just picking up the fact that both series are trending. Indeed, even if they would be completely unrelated the coefficient estimate would come out similarly. Of course, here we (a) have reason they are related, (b) have statistical support for such conclusion, (c) the model fit suggests that things are not just random. Still, the problems arising from using trending variables are likely to bias our coefficient estimates upward, and hence bias our estimate excess level of food prices downwards.